


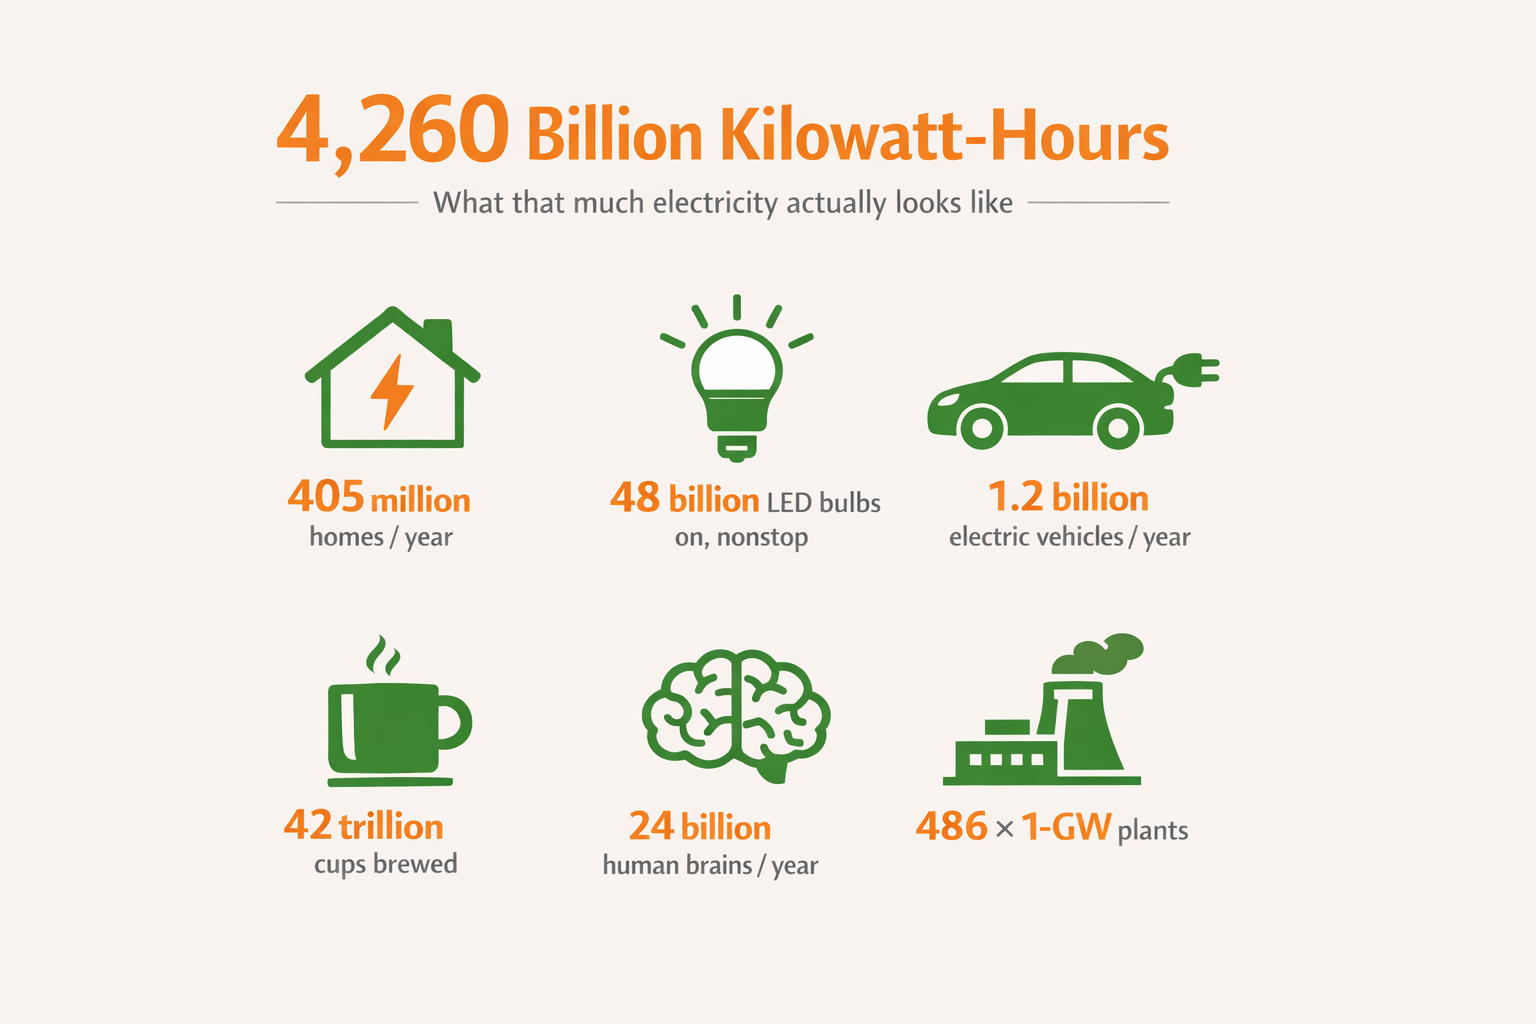
 What factors are driving retail electricity costs in Texas in 2025?
By Adam Glick, Solar Sherpa, NATiVE Solar
Short answer: It’s not just solar. And it’s a bit more complex than many realize. A new analysis from Lawrence Berkeley National Laboratory (LBNL) and The Brattle Group, covered by PV Magazine USA this week, shows that retail electricity rates reflect a mix of fuel costs, extreme weather recovery, transmission investments, and policy design. I wanted to dig into this a bit but and also focus a bit on regional market specifically. In Texas, where the electricity market is largely deregulated and demand continues to surge, the broader findings come with a local twist. ERCOT’s wholesale markets tell one story; retail bills tell another.
The common myth: more solar means cheaper power
It sounds intuitive. Sunlight is free, panels keep improving, and Texas is a national leader. And the fact is that sometimes retail prices do fall when clean generation scales. But often they don’t -because retail rates include far more than energy generation. Your bill have line items which also recover transmission and distribution costs, disaster recovery spending, and policy compliance surcharges. If those rise faster than wholesale savings, bills go up. This may be ok for owners of solar panels -but the rest of grid subscribers are still exposed to rising costs.
Eight forces that move retail electricity prices in Texas (and across the nation)
Natural gas prices
Texas relies heavily on natural gas generation, which still sets marginal power prices in ERCOT. When gas prices spike, wholesale costs surge and retail rates follow. ERCOT’s real-time and day-ahead price dashboards show just how volatile the market can be. The EIA Texas profile confirms fuel costs remain the top driver of short-term rate changes. This makes sense , I guess.
Extreme weather and wildfire costs
Storm repairs, wildfire mitigation, and hardening programs raise utility costs that must later be recovered through rates. After Winter Storm Uri a few years back, ERCOT and regional utilities threw billions of dollars at grid-hardening and weatherization across the state, pushing transmission and reliability surcharges higher. NRG’s 2025 ERCOT transmission cost report notes a 116% rise in transmission costs since 2013, with nearly $15 billion in new projects approved. You didn’t think they were going to just “eat” the cost did you?
Utility-scale solar and wind (market-driven)
Large renewable projects continue to lower wholesale generation costs because they consume no fuel and are very low-maintenance (relatively inexpensive to maintain). According to LBNL’s 2024 Utility-Scale Solar report, Texas remains one of the most competitive markets for low-cost solar power. This is great for owners of solar harvestinng and smart energy menegment systems. Yet, everybody, especially other (non-solar) retail customers see mixed effects, since renewable’s savings at the wholesale level can be diluted by rising delivery and policy costs.
Renewable Portfolio Standards (RPS)
Some states require utilities to meet renewable generation targets through RPS mandates, which can temporarily raise costs. Texas technically retired its RPS after exceeding its original 2025 goal early, showing how market-driven deployment (not mandates) now leads renewable growth. That’s helped keep prices more stable compared to many other states. LBNL data still found small RPS-related price impacts nationally (~0.25–1 ¢/kWh). I hope we can keep up the momentum but we already *know* that most market indicators for investment into 2026/2027 are showiing a flat to downward trend -and rate-paying Texans will likely bear some costs.
Net-metered rooftop solar growth
Rooftop solar changes how utilities recover fixed costs. With more solar rooftops resulting in fewer kWh of energy sold to retail subscribers, the remaining customers cover a larger share of transmission and maintenance costs. LBNL finds modest price effects (<0.5 ¢/kWh) in most states and larger increases (up to 2 ¢/kWh) in a few high-adoption areas like California. Texas avoided these spikes by modernizing its retail rate design early -most areas use value-based credits instead of full retail net-metering. ComparePower.com shows average Texas retail rates around 15.2 ¢/kWh as of August 2025, still below the U.S. average. Utilities don’t typically pay you (the solar-connected rate payer) the full value to the solar you collect, use or send back to the grid. They see solar energy as a great benefit to all -so long as they can continue to spread the costs around. :/ It’s a real conundrum and I don’t have a smart answer to share here.
Load growth or decline
ERCOT demand is climbing fast—by about 7% in 2025 and 14% in 2026, according to the EIA Today in Energy forecast. New industrial loads like data centers, crypto facilities, and battery manufacturing are boosting both peak demand and total sales, helping to spread fixed costs across more kWh and potentially softening rate pressure. The general laws of supply and demand have a big place at the table here.
Transmission and grid upgrades
Transmission expansion has become one of the biggest cost components of Texas power bills. NRG’s 2025 ERCOT transmission report documents that total transmission charges have more than doubled since 2013—driven by renewable integration, reliability upgrades, and weatherization mandates. They’re (finally) spending here in Texas to strengthen the transmission networks. Here too, the costs are getting passed around…
What this means for Texas
Utility-scale solar growth has helped contain wholesale price spikes in ERCOT during record heat and demand peaks. Solar-equipped residences and businesses have greatly reduced those property owners’ bills while further strengthening grid resilience. Still, retail bills are rising and reflect transmission and reliability investments that were long overdue. EIA’s Texas data shows residential rates averaging about 15.36 ¢/kWh as of July 2025—roughly 13% below the national average. Wholesale solar harvesting (and other renewables) is cushioning rate pressure, but infrastructure and weather costs remain unavoidable.
Historical rate data from Texas Electricity Ratings shows typical provider rates between 14 ¢ and 20 ¢/kWh, illustrating both market diversity and consumer opportunity in the competitive landscape.
Here’s perhaps what we need more of from the retsil energy providers, utilities, and ERCOT to keep prices fair :
Align rates with system value
Use time-of-use pricing so customers pay less when solar is abundant and more when the grid is constrained. ERCOT’s dynamic wholesale signals make this increasingly feasible for residential providers but we need the political will to get laws and policy passed at the state legislative level.
Encourage solar plus storage
Pairing solar with batteries shifts energy from midday to evening peaks, reducing costly ramping and delivering measurable savings for both the homeowner and the grid.
Be transparent about cost recovery
Clear line-item cost recovery—especially for transmission and resilience—helps customers understand why bills move. The Texas deregulated market provides this transparency more effectively than most regions.
Keep building low-cost utility-scale renewables
Utility-scale solar remains one of the most effective tools for long-term price stability. LBNL’s report shows Texas among the lowest-cost markets nationally, with project-level costs dropping below $25/MWh.
The bottom line
Retail electricity prices are being driven by a mix of factors -fuel volatility, storm recovery, transmission spending, and policy design. Utility-scale renewables lower costs; rooftop solar’s impact also helps but depends on emerging rate structures and equipment installation costs. With smart policy and transparent pricing, clean energy and affordability can move in the same direction.
Thanks for reading, ya’ll. More soon…
Sources and further reading
- PV Magazine USA: Solar deployment and policies have had a mixed effect on electricity prices
- LBNL: Retail Electricity Price and Cost Trends
- The Brattle Group: Contributions to LBNL’s price analysis
- LBNL: Utility-Scale Solar 2024 Edition
- EIA: Texas State Energy Profile
- EIA Today in Energy: Texas electricity demand growth projections
- NRG: ERCOT Transmission Costs and Rate Design (2025 remarks)
- Texas Electricity Ratings: Historical retail rates
- ComparePower: Texas electricity price averages and provider comparison
- Wikipedia: Deregulation of the
Connect with one of NATiVE’s commercial or residential solar practitioners today!


Leave A Comment